Process Measures
Continual improvement has its basis in process measures. Deming is quoted as stating “You can’t improve what you don’t measure.” Think about that for a moment….
A different way to say the same thing is “if you don’t measure first, you won’t know if you’ve improved.” Improvement opportunities come from your data, corrections come from your data… it’s all about the data! But where is this data coming from?
Clause 8.2.3 of ISO 9001 states that organizations will monitor their processes and measure when applicable. Monitoring is good, but collecting data and making decisions regarding that data is better.
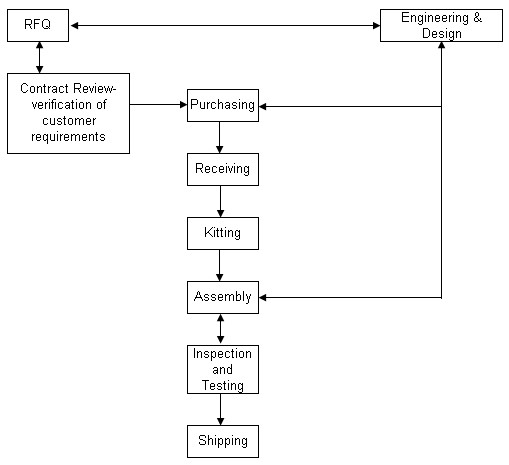
The diagram below displays the flow of a typical contract manufacturer with each key function shown. Clause 7.1 implies that your organization already understands this flow.

Using the Engineering and Design function as an example, determine several potential metrics. These might include:
- Overall Design Time
- Launch Issues
- Late to Program Target Date
- Omissions in Documentation
Now your organization must decide which of these metrics is most important to the success of the company, and will help to improve the Design function. Questions to ask might be:
- What issues does Design have historically?
- What current issues are we seeing within the Design Team?
- Which process measure will give us the best improvement opportunities?
Top Management ultimately owns this decision-making system. Input from other departments is also helpful in selecting the appropriate metric. In this example, management wanted to improve upon the number of product launch issues.
The other department heads identified that their biggest concern with the Design Function was that they were late to the target date. The result of Design being late was the other departments had to compress their schedules to meet customer requirements.
So far, so good, but clause 8.2.3 also states that the metrics prove the key functions of our organization meet the results we planned to achieve. This means that the metrics must have target values attached to them.
In our Design example, the company would likely set both the Launch Issues and the Late to Target date targets to zero. It is understood that occasionally the Design Team will be late, or a mistake is made creating a launch issue.
However, setting this target above zero sends the message that top management believes that errors are acceptable. Errors happen, but we should never consider any level of mistakes as acceptable!
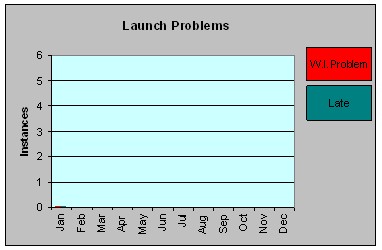
Next, we chart the data. Most spreadsheet programs have satisfactory charting capabilities. This enables your organization to analyze the data for trends, allowing for a proactive approach to your problem solving strategies and continual improvement. A graph of charted data for the Design Team is shown below.

Return from Process Measures to the QMS page
Want to know more about another prominent metric? Read about DPMO which is an important Six Sigma metric


