Analysis of Data
The next step in utilizing your QMS is the analysis of data. Clause 8.4 of ISO 9001 spells out the requirements and is a direct link to one of the underlying management principles, Factual Approach to Decision Making. The eight management principles are detailed on our overview of ISO 9001 page. The standard states that specific data is to be collected and analyzed. These required measures include:

- Customer satisfaction and customer perception of how well you meet their requirements and expectations
- Measures relating to product conformance
- Suppliers
- Process and product trends- this includes evaluating the possibilities for preventive action and continual improvement
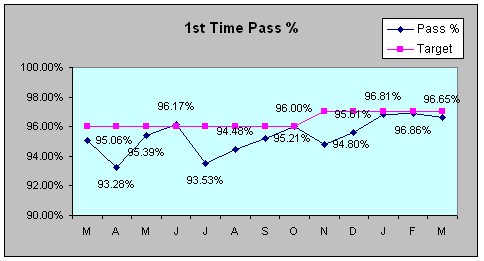
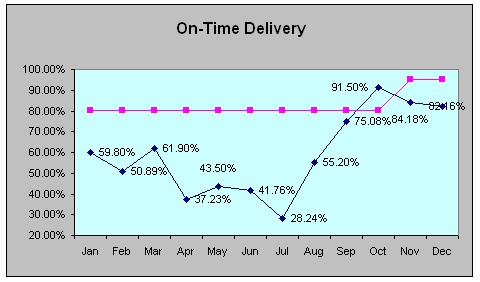
All of your process metrics are required to be examined during management review. However, if your company elects to conduct this meeting annually, you may not be getting the most benefit from this data analysis. In the metrics graphed below we see process statistics covering 12 months.


Interpreting the Graphs
These graphs show in the most recent two collection periods that the process metric did not meet the goal or target for the process. Both the On-Time Delivery and First Time Pass charts illustrate that our processes are not performing as planned. Examination and improvement of these processes is required.
The frequency of the analysis of data is left up to each organization. But the frequency needs to make sense. Think of it like this, most companies don’t wait 4 months after receiving a customer complaint to begin an investigation into what happened to cause an unhappy customer. Generally the fact finding begins immediately. The same principles should apply for the review of process metrics. Perhaps not immediately, but the process owners (department heads, supervisors, etc.) need to study this information regularly.
Clause 8.2.3 tells us that we must correct the process when the target is not met. It is certainly not in your company’s best interest to make decisions based upon process data that is nearly a year old. For that matter, it’s also unwise to make adjustments based upon 6 month old data as well. Your company must determine the appropriate review interval for analysis of this data. The graphs indicate the data is reviewed each month. Other metrics, like individual manufacturing or assembly area yield metrics, may suggest weekly review.
These graphs show additional information that should also be identified. This is covered with more detail in the Management Review section.


